Trade
Basic
Futures
Futures
Hundreds of contracts settled in USDT or BTC
TradFi
Gold
Trade global traditional assets with USDT in one place
Options
Hot
Trade European-style vanilla options
Unified Account
Maximize your capital efficiency
Demo Trading
Futures Kickoff
Get prepared for your futures trading
Futures Events
Participate in events to win generous rewards
Demo Trading
Use virtual funds to experience risk-free trading
Earn
Launch
CandyDrop
Collect candies to earn airdrops
Launchpool
Quick staking, earn potential new tokens
HODLer Airdrop
Hold GT and get massive airdrops for free
Launchpad
Be early to the next big token project
Alpha Points
Trade on-chain assets and enjoy airdrop rewards!
Futures Points
Earn futures points and claim airdrop rewards
Investment
Simple Earn
Earn interests with idle tokens
Auto-Invest
Auto-invest on a regular basis
Dual Investment
Buy low and sell high to take profits from price fluctuations
Soft Staking
Earn rewards with flexible staking
Crypto Loan
0 Fees
Pledge one crypto to borrow another
Lending Center
One-stop lending hub
VIP Wealth Hub
Customized wealth management empowers your assets growth
Private Wealth Management
Customized asset management to grow your digital assets
Quant Fund
Top asset management team helps you profit without hassle
Staking
Stake cryptos to earn in PoS products
Smart Leverage
New
No forced liquidation before maturity, worry-free leveraged gains
GUSD Minting
Use USDT/USDC to mint GUSD for treasury-level yields
More
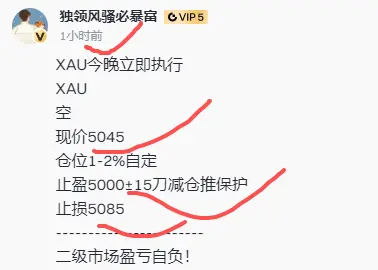
DominanceWillMakeYou
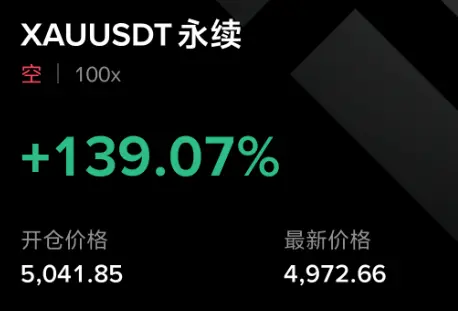
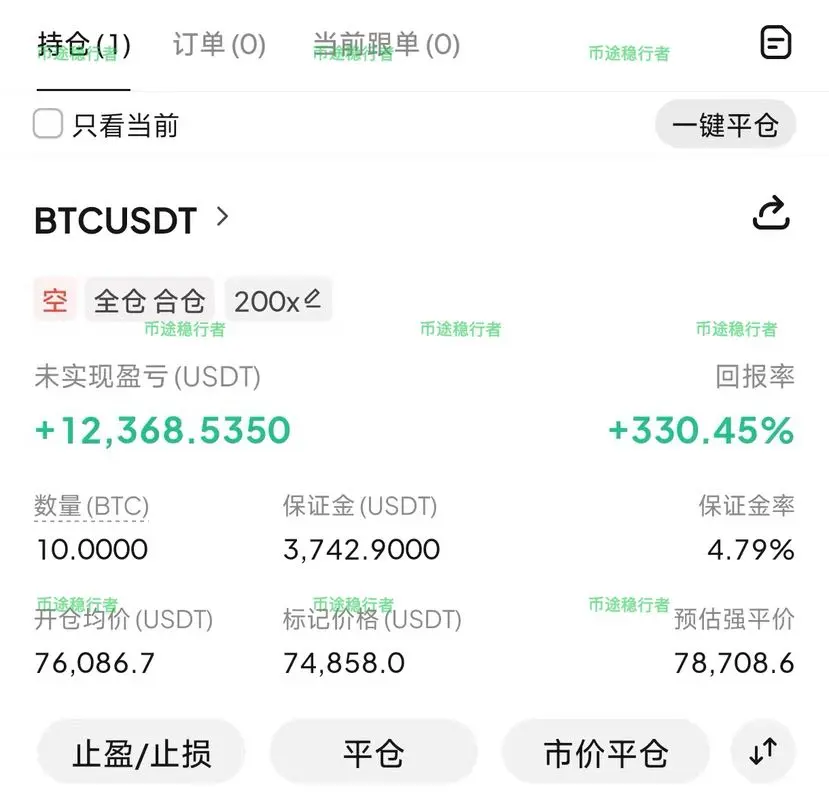
$XAU Small Kong has already reduced 60% of the position to push this order with zero risk.
Directly reimburse the midnight snack for the entire骚家军.
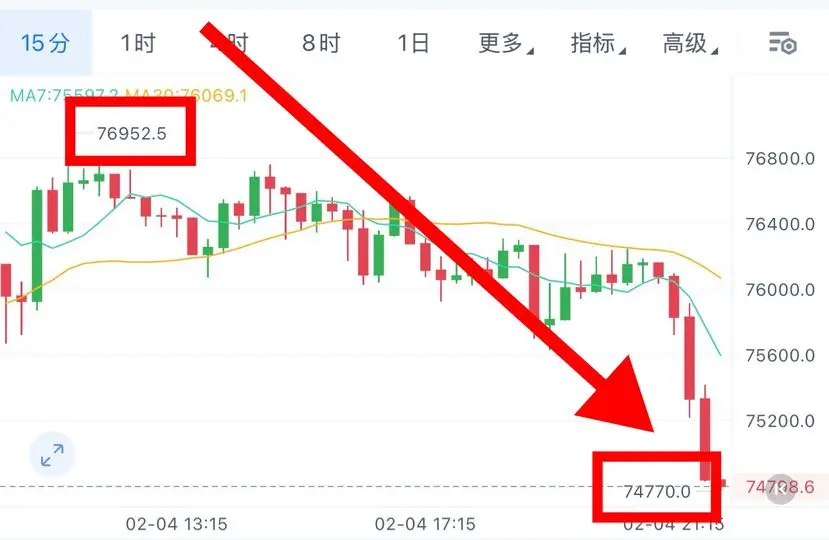
#加密市场隔夜V型震荡
Directly reimburse the midnight snack for the entire骚家军.
#加密市场隔夜V型震荡
View Original
- Reward
- 3
- Comment
- Repost
- Share
- Reward
- like
- Comment
- Repost
- Share
JUST IN: 🟠 $7 trillion UBS Group CEO Sergio Ermotti said the bank is considering offering access to #crypto for individual clients. #crypto
- Reward
- like
- Comment
- Repost
- Share
XPTUSD
XPTUSD
Created By@High-FrequencyHedging
Listing Progress
0.00%
MC:
$2.65K
Create My Token
New day, another reminder that there’s no plan B.
- Reward
- like
- Comment
- Repost
- Share
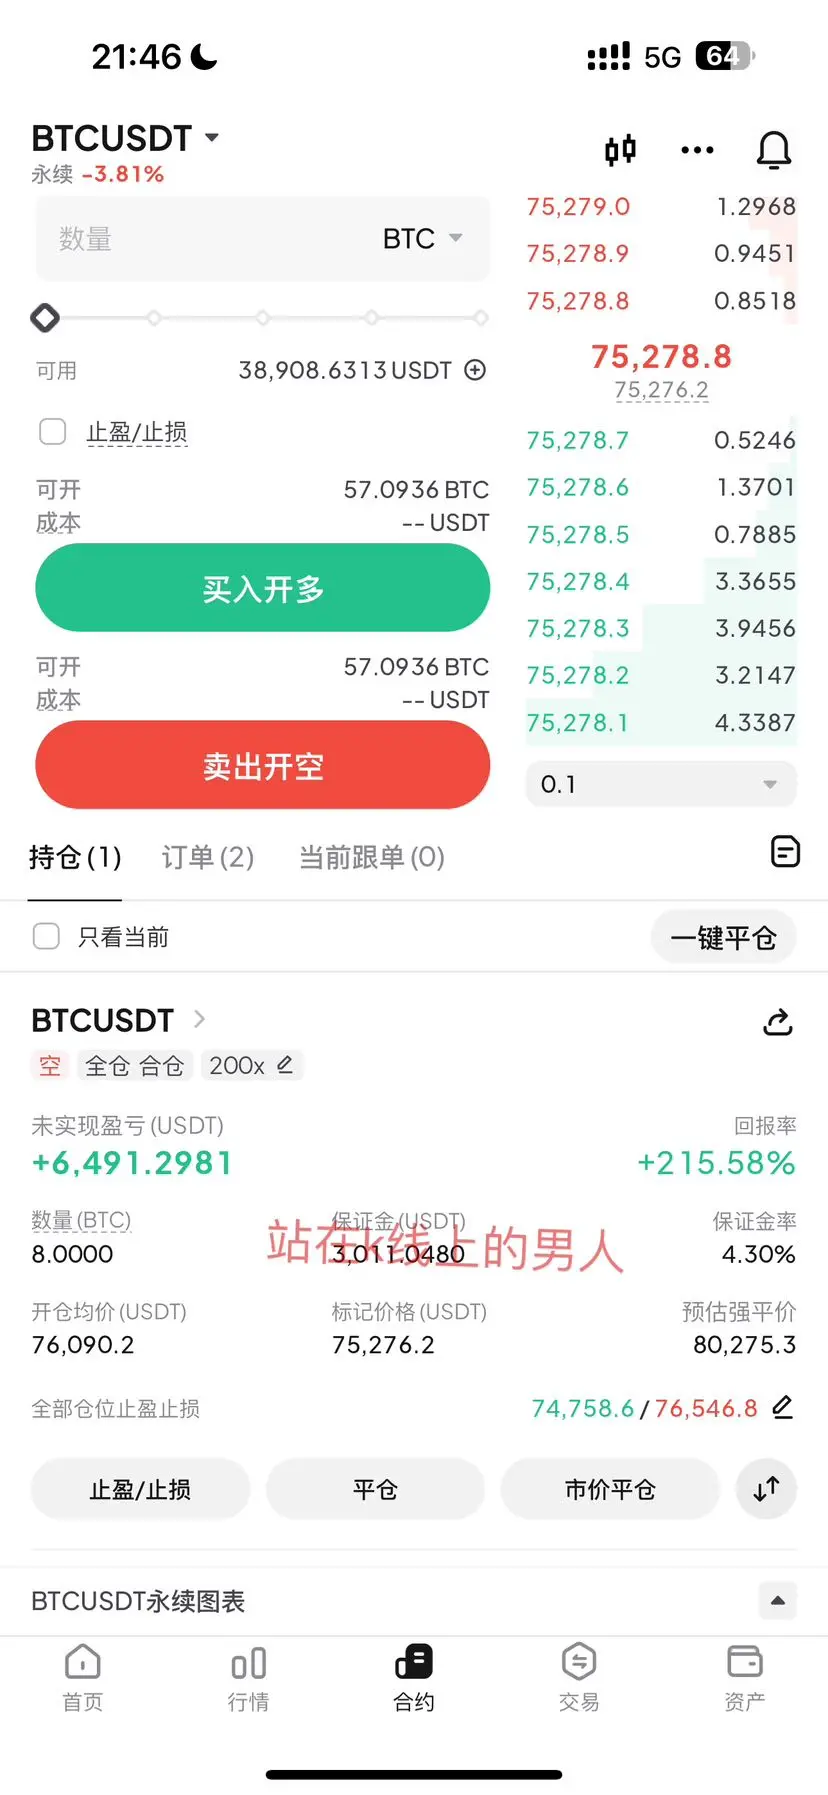
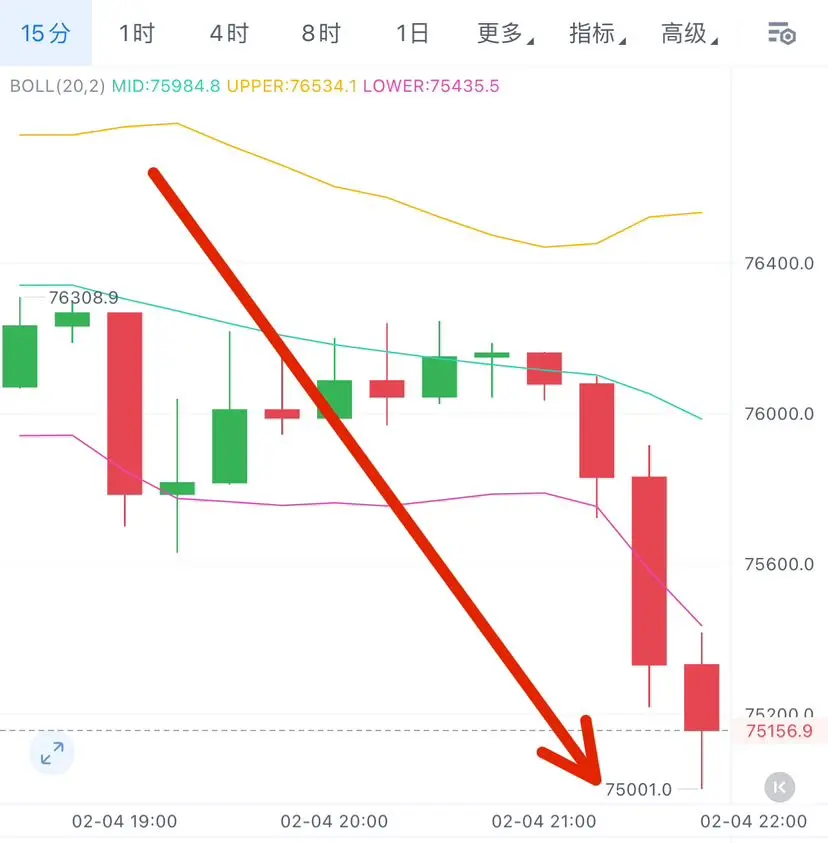
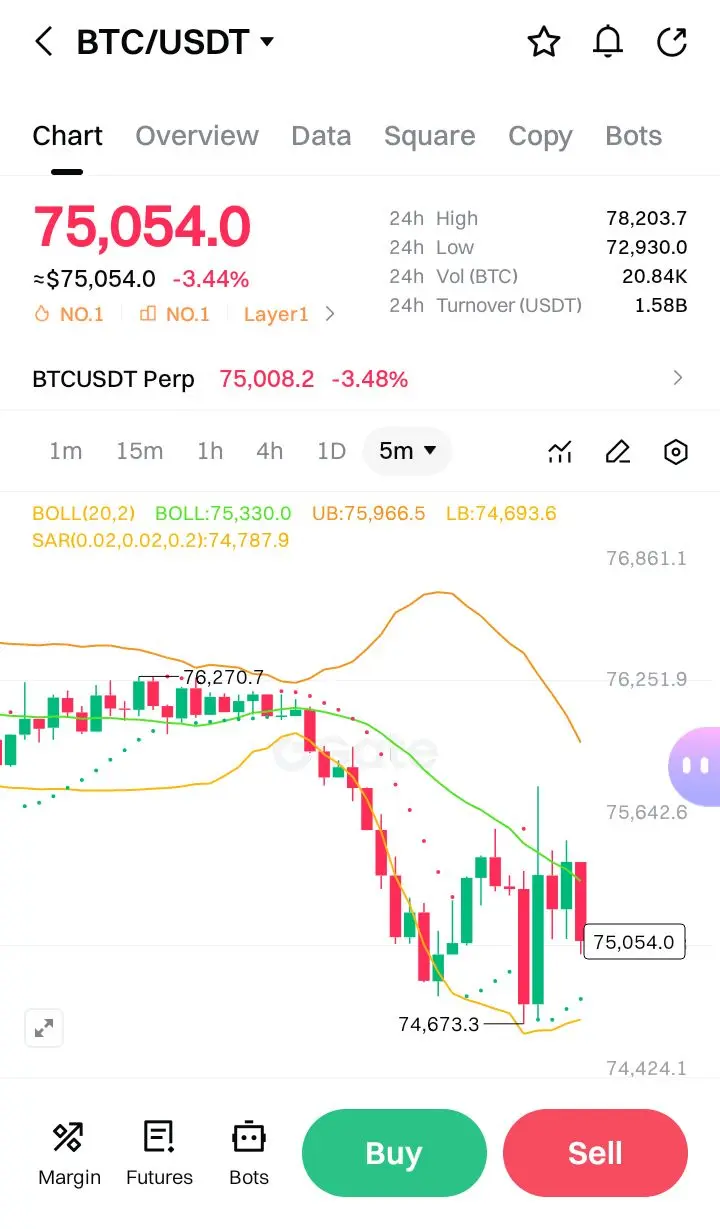
$BTC BTC/USDT chart and indicators, Here is a technical analysis:
Overall Trend: Bearish
The price is in a clear short-term downtrend, having fallen over 3.4% from the 24-hour high. It is trading below key indicator lines, confirming selling pressure.
Key Indicator Analysis:
1. Bollinger Bands (20,2):
· The price (75,054.0) is trading at the Lower Band (LB: 74,693.6). This indicates the market is under significant selling pressure and is potentially oversold in the very short term.
· The middle band (BOLL: 75,330.0) and the Upper Band (UB: 75,966.5) are acting as immediate resistance le
BTC-4,11%

- Reward
- 1
- Comment
- Repost
- Share
- Reward
- like
- Comment
- Repost
- Share

#AIBT AIBT is now ignoring me, and you won't be able to reach me in the future. Let's get started!
View Original


- Reward
- 2
- Comment
- Repost
- Share
#GateLunarNewYearOn-ChainGala
🌕✨ Celebrating the Lunar New Year in True On-Chain Style! ✨🌕
As the Lunar New Year dawns upon us, the world of blockchain and crypto is coming alive with excitement, innovation, and a touch of tradition. This year, the #GateLunarNewYearOn-ChainGala promises to be a celebration like no other a unique fusion of cultural heritage, digital innovation, and community connection. From seasoned crypto enthusiasts to newcomers eager to explore the blockchain universe, this gala is a testament to how technology is reshaping the way we celebrate milestones, traditions, an

- Reward
- 1
- Comment
- Repost
- Share
[New Streamer]Bull vs bear battle: optimal entry levels explained live
1.020
- Reward
- like
- Comment
- Repost
- Share
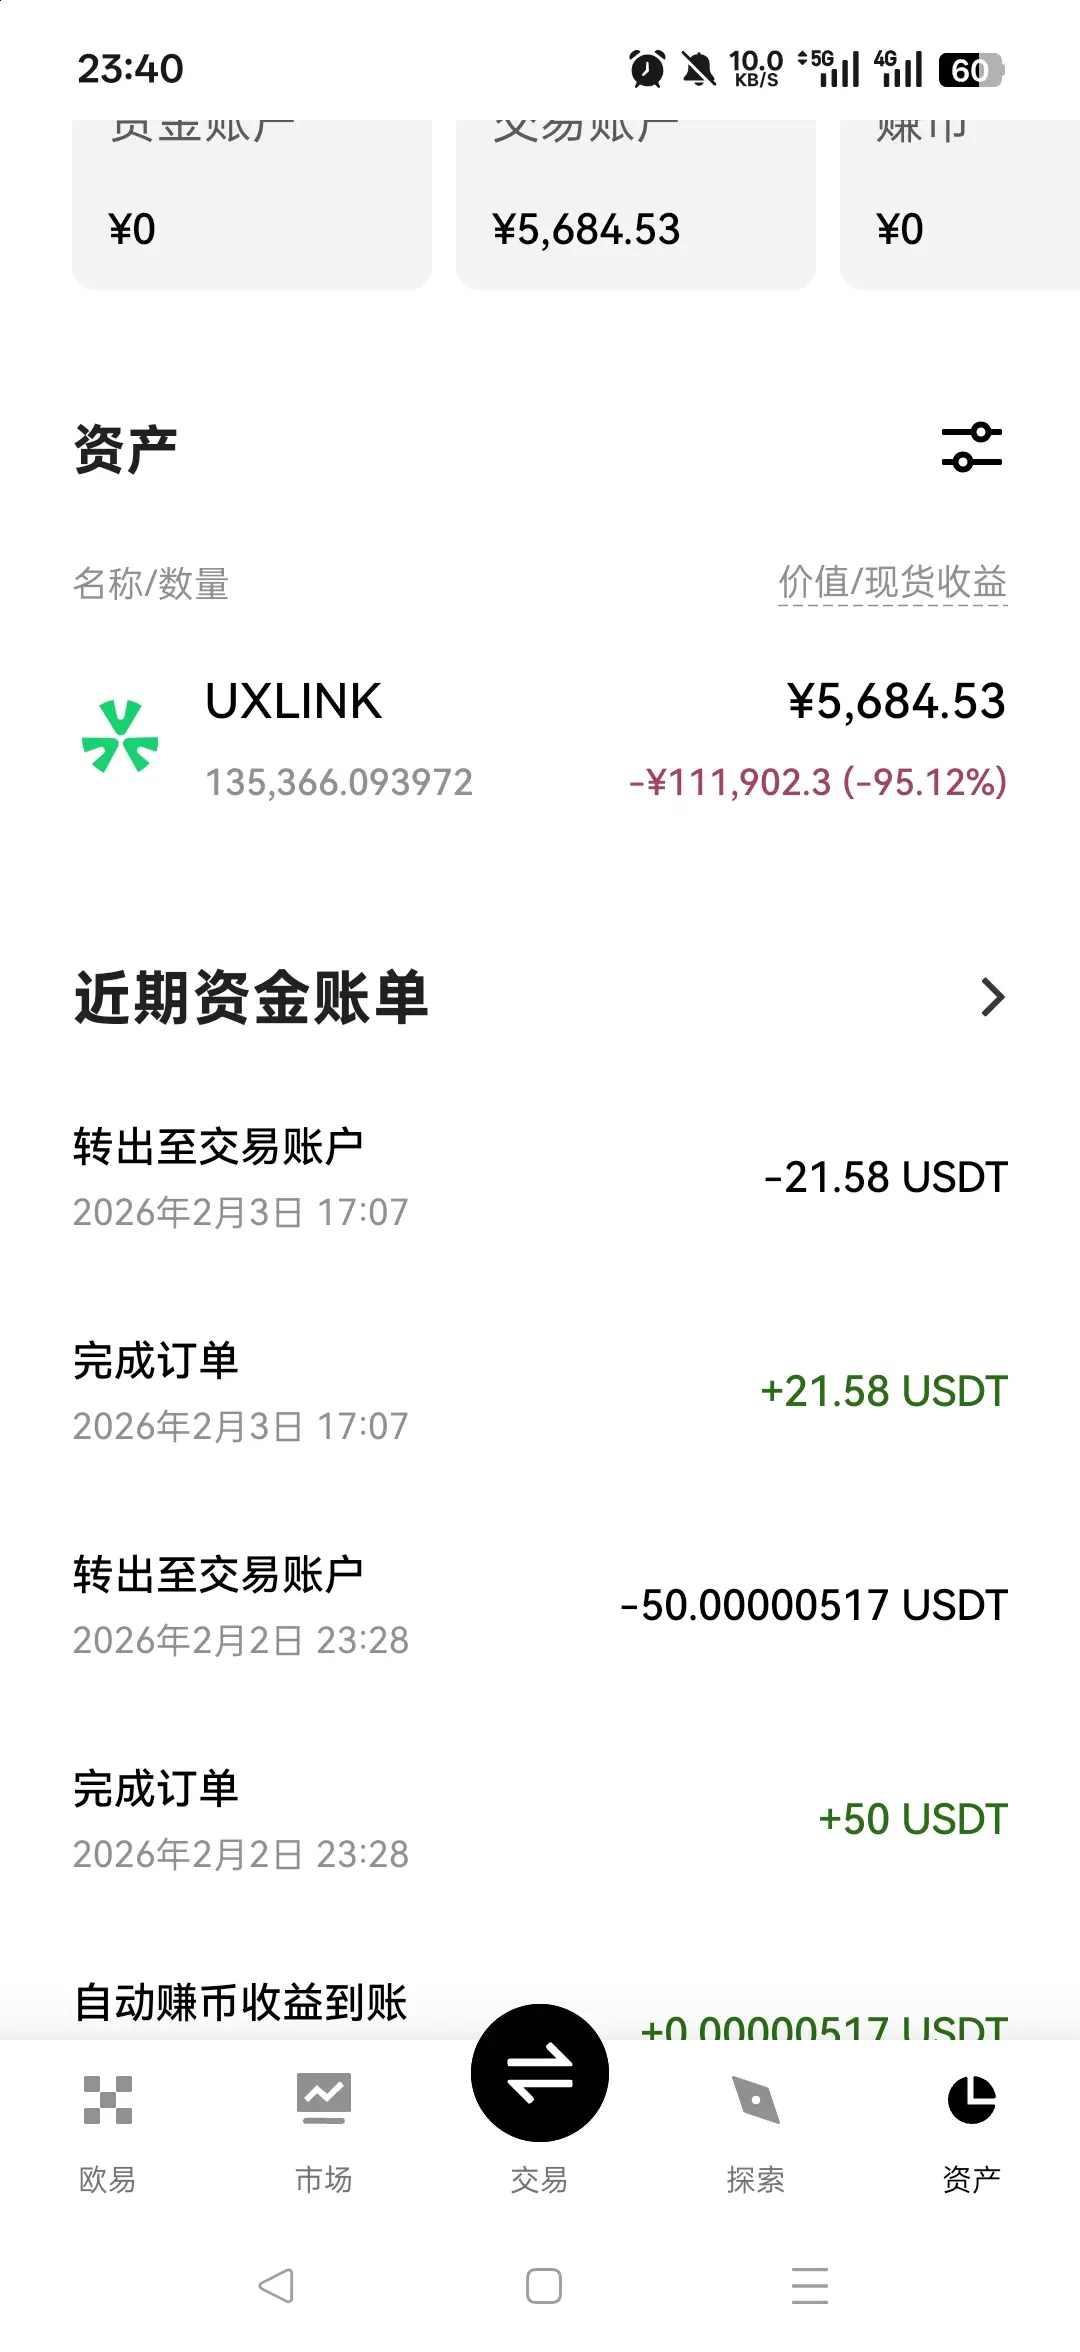
Bought the dip at the halfway point up the mountain, thinking I was clever, but in the end, it’s all just a gamble. If I get burned, at worst I’ll lose everything and go back to zero.
UXLINK-13,67%
- Reward
- like
- Comment
- Repost
- Share
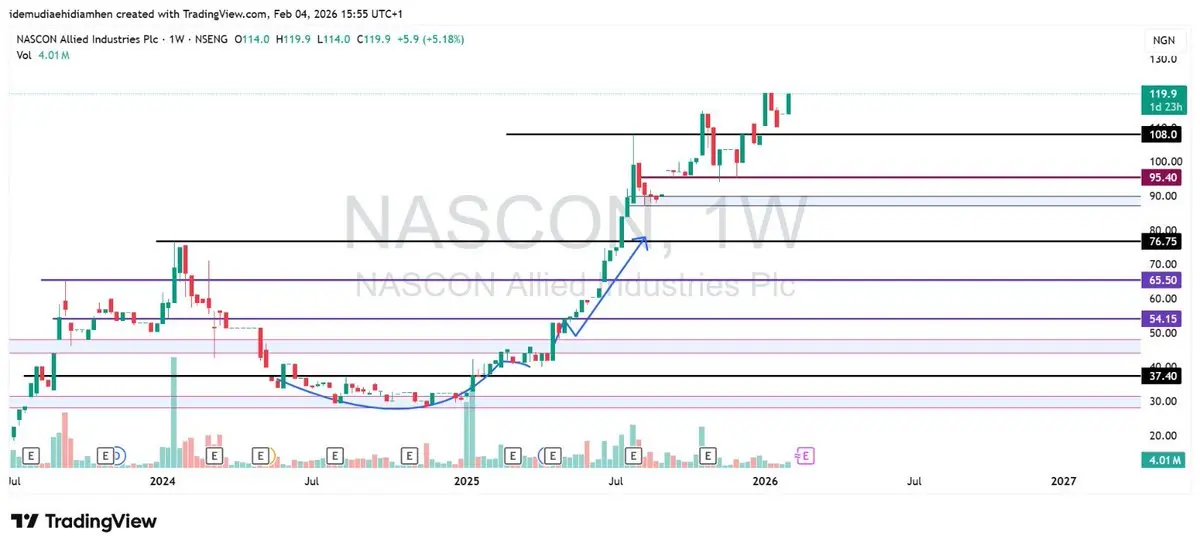
NASCON Are we gonna see a new ATH for this beautiful company tomorrow? Time will tell #NFA
- Reward
- like
- Comment
- Repost
- Share
XTIUSD
WTI原油
Created By@High-FrequencyHedging
Listing Progress
0.00%
MC:
$0.1
Create My Token
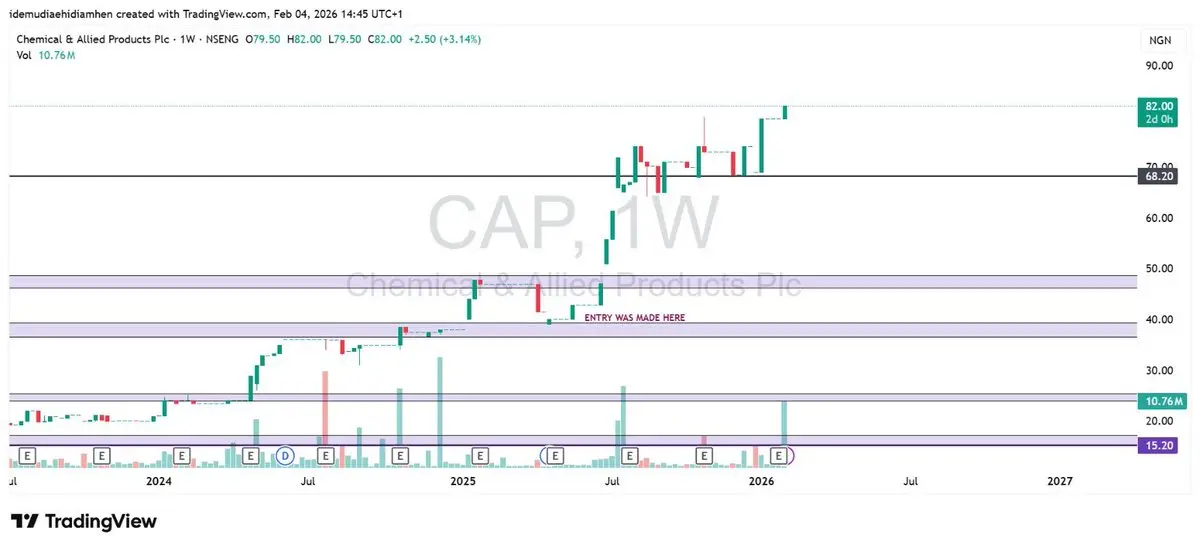
CAP Hit a new 52-week high of N82/share after seeing the bazooka that Berger paint did, and CAP couldn\'t take it but had to deliver. ROAD TO N100/SHARE #NFA
- Reward
- like
- Comment
- Repost
- Share
Gate Live 2026 Lunar New Year On-Chain Gala · Non-Stop Market Insights https://www.gate.com/campaigns/3937?ref_type=132
- Reward
- 2
- 2
- Repost
- Share
Luna_Star:
Buy To Earn 💎View More
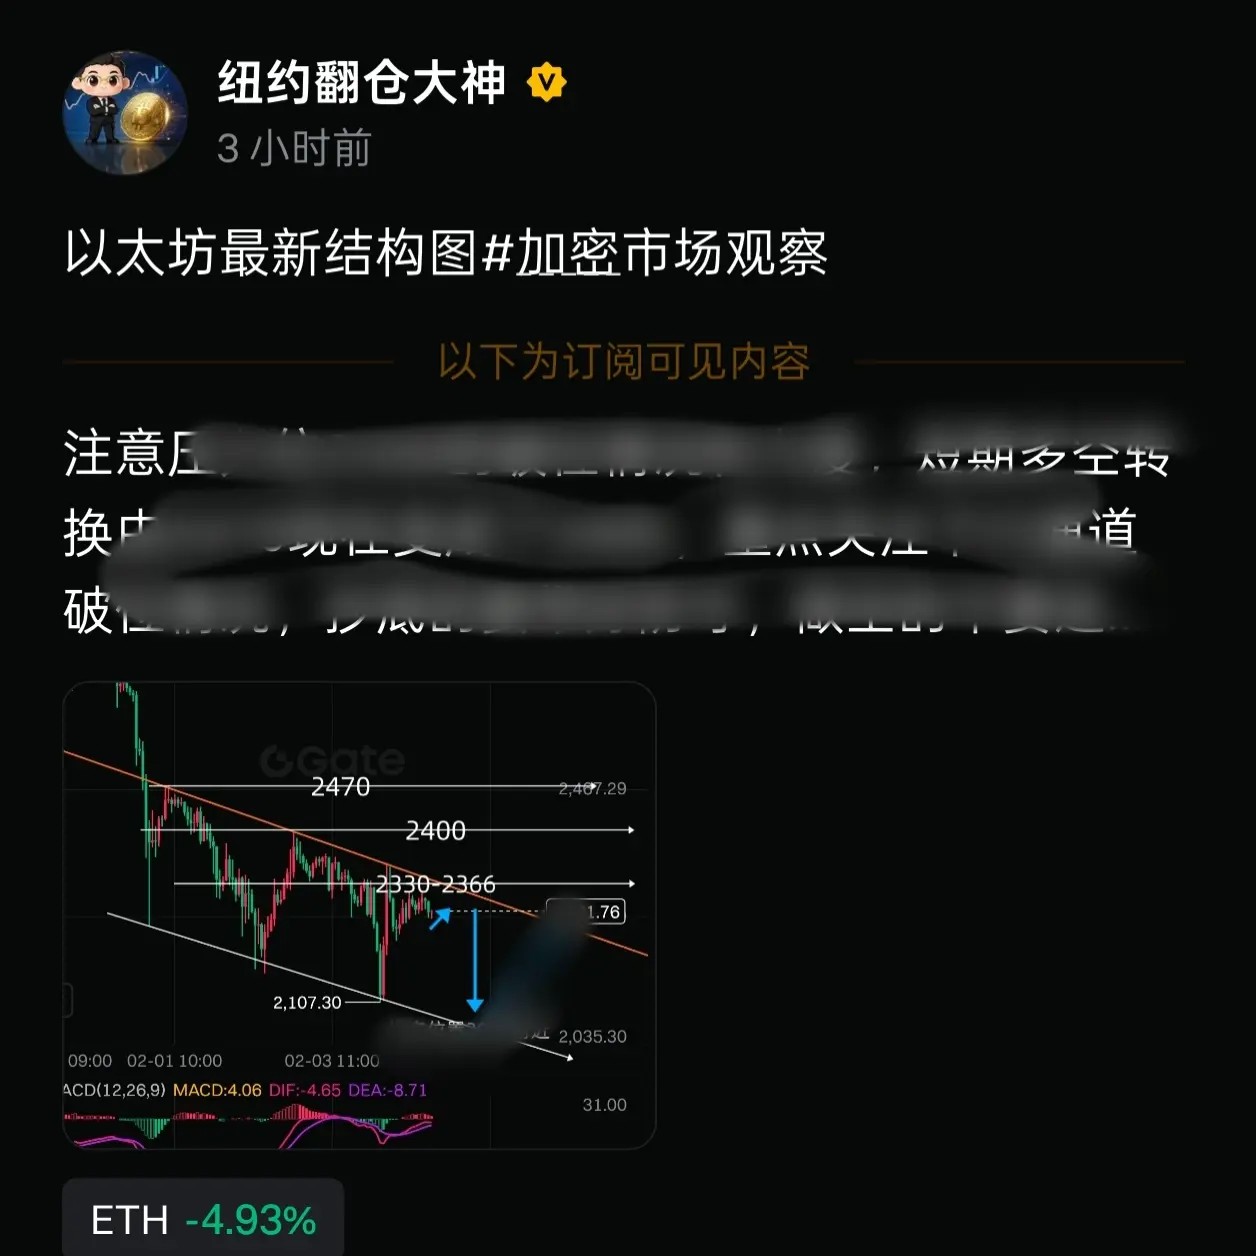
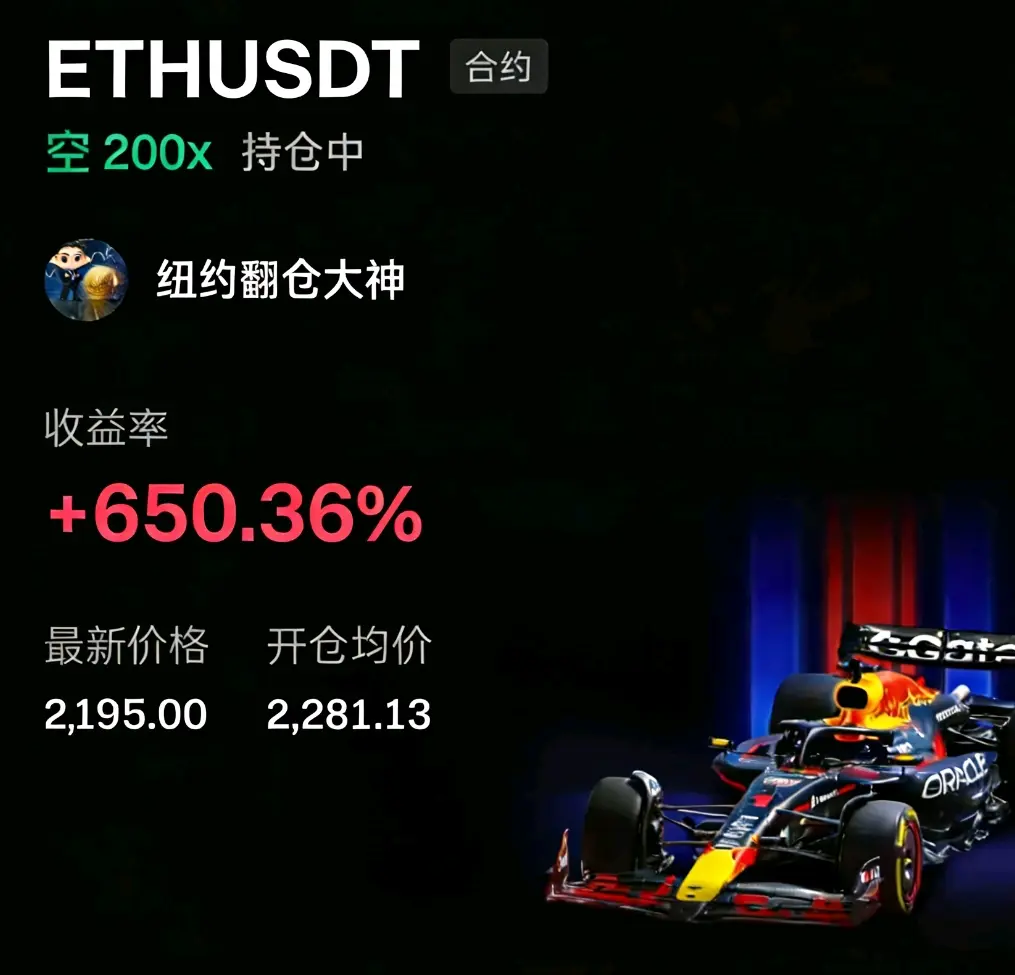
Ethereum and Bitcoin are rallying—come and report in. My subscribed friends already knew early this morning where they could open positions and where they couldn't. Probably no one is long on 2280, right?
In just three hours, the entire web of the market was clearly mapped out. Based on personal trading habits, I have already entered positions at suitable levels. Predicting the market trend—please stay tuned to the subscription of the singing master!#加密市场观察
View OriginalIn just three hours, the entire web of the market was clearly mapped out. Based on personal trading habits, I have already entered positions at suitable levels. Predicting the market trend—please stay tuned to the subscription of the singing master!#加密市场观察
- Reward
- 2
- 5
- Repost
- Share
HealthIsWealth2026 :
:
Master, I haven't run yet, is that okay?View More
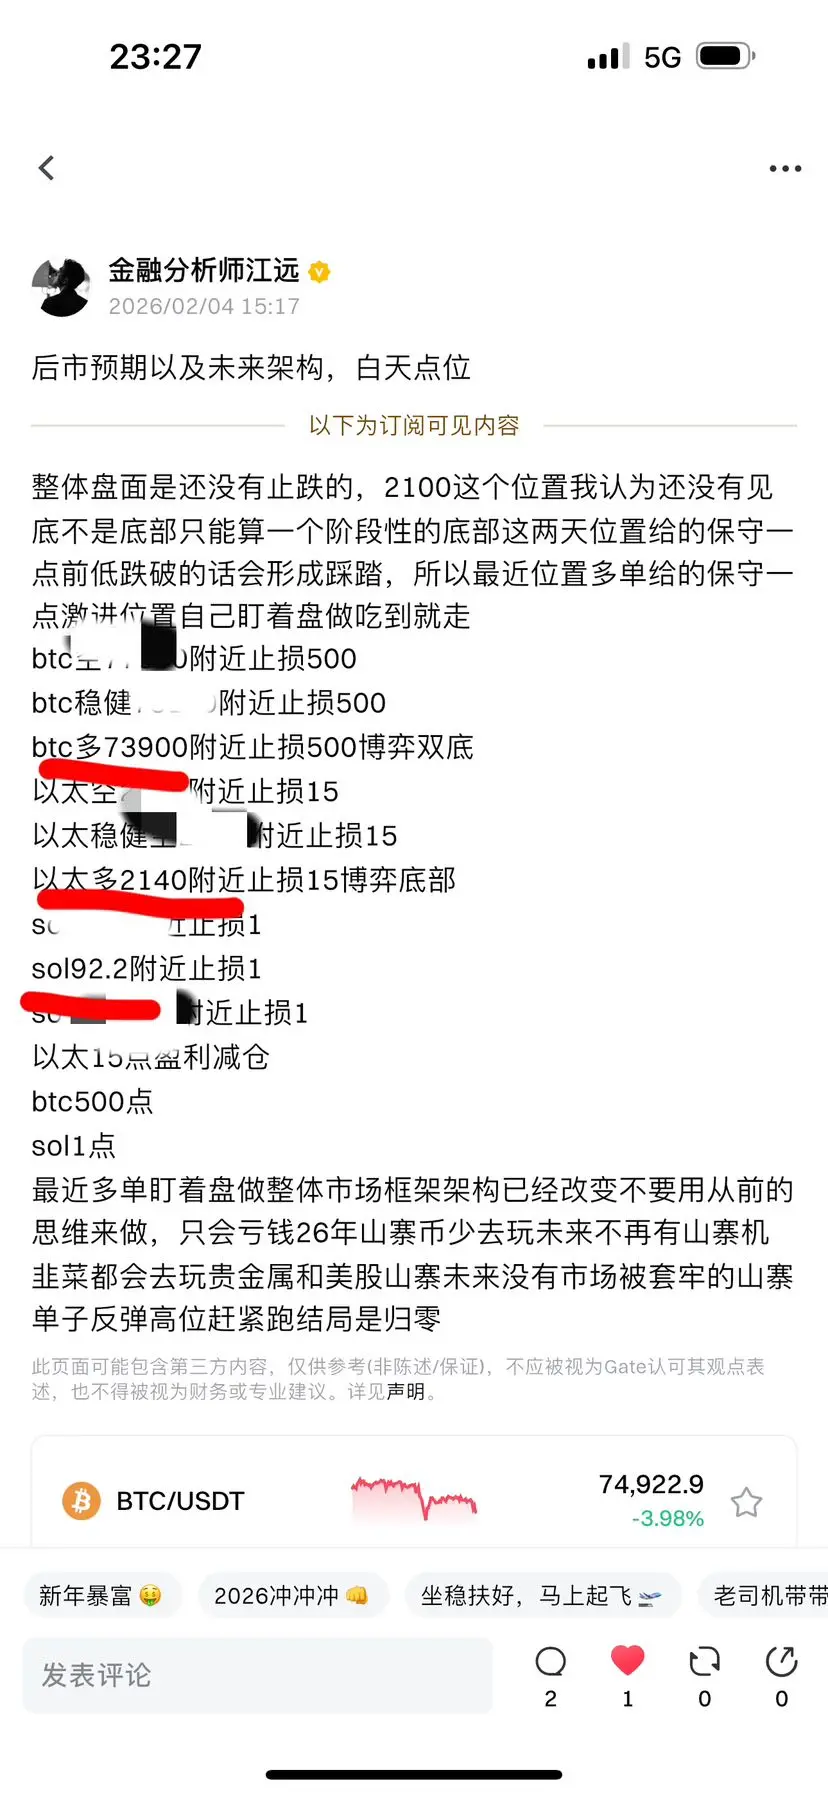
Today's subscription updates: all long positions successfully entered, profit taken upon exit.
BTC 73,900, highest point 75,400, gained 1,500 points.
Ethereum 2,140, currently floating profit of 30 points.
Sol 92.1, gained about 2 points.
View OriginalBTC 73,900, highest point 75,400, gained 1,500 points.
Ethereum 2,140, currently floating profit of 30 points.
Sol 92.1, gained about 2 points.
- Reward
- 1
- Comment
- Repost
- Share
$BTG BTG follows the market correction to the $5.3 range, with solid support at the current price level and a trend tending to stabilize. Hold your positions firmly and avoid making short-term paper trades; once the market starts moving again, selling too early will only lead to regret. The ecosystem is gradually taking shape.
BTG-4,09%

- Reward
- like
- Comment
- Repost
- Share
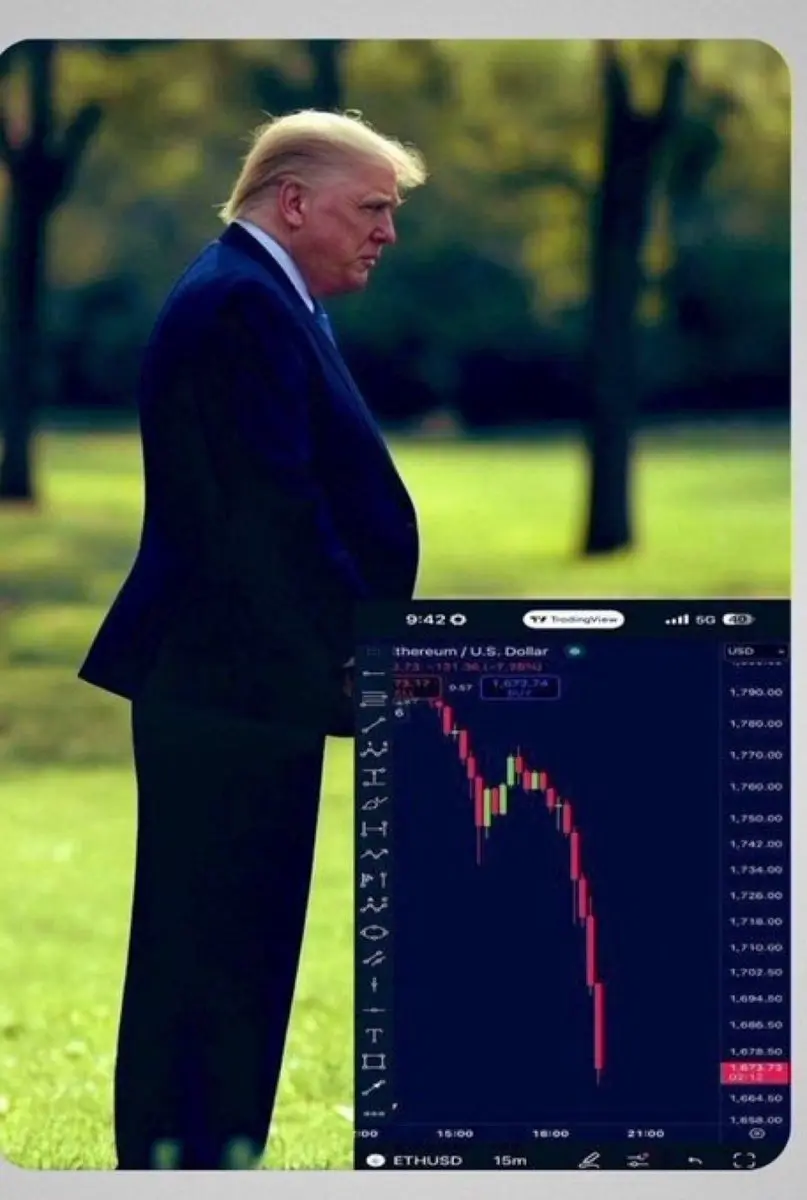
Everything Trump promised about crypto was a lie
- Reward
- like
- Comment
- Repost
- Share
Portfolio nuking daily mood
View Original- Reward
- like
- Comment
- Repost
- Share
- Reward
- like
- 1
- Repost
- Share
ZongJing :
:
Stay strong and HODL💎Load More
Join 40M users in our growing community
⚡️ Join 40M users in the crypto craze discussion
💬 Engage with your favorite top creators
👍 See what interests you
Trending Topics
View More14.58K Popularity
9.75K Popularity
8.57K Popularity
3.29K Popularity
5.54K Popularity
Hot Gate Fun
View More- MC:$0.1Holders:10.00%
- MC:$0.1Holders:10.00%
- MC:$0.1Holders:00.00%
- MC:$2.65KHolders:10.00%
- MC:$0.1Holders:10.00%
News
View MoreNasdaq short-term rally, intraday decline narrowed to 0.6%
4 m
In the past 4 hours, the entire network has been liquidated by $165 million, with BTC liquidations reaching $55.19 million.
5 m
Spot gold has fallen back by $200 from the daily high, reflecting a significant decline in the precious metal's price amid changing market conditions.
6 m
BTC drops below 74,000 USDT
9 m
ETH drops below 2150 USDT
9 m
Pin